
Page 163 - CJ 2019 INTEGRATED REPORT
P. 163
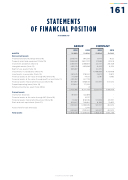
161
STATEMENTS
OF FINANCIAL POSITION 31 DECEMBER 2019
GROUP
2018
ASSETS Rs’000
Rs’000
Non-current assets
COMPANY 2018
Rs’000
8
122 62 419 218 328 6 524 - 4 4 4 424 168 31 872 11 992 - 337 434 - - 5 5 100 859
- - 451 557 10 853 462 410 - 462 410 5 5 563 269
2019
Rs’000
2 189 346
2 998 581
2 488 351
402 570
995 887
- 387 440
717 568
402 362
657 867
165 844
- 11 405 816 187 653
- 774 182
601 847
1 563 682
- 1 563 682
12 969 498
2019
Rs’000
8
144
57 688
241 757
6 402 44 275
4 4 498
068
31 872 12 781
- 337 787
- - 5 238 774 - - 573 169
8
8
368
581
537
- 581
537
5 820 311
Freehold land and and buildings (Note 10) Property plant and equipment
(Note 10) Investment properties (Note 11) Intangible assets
(Note 12)
Right of use assets
(Note 13)
Investments in subsidiaries (Note 14)
Investments in associates
(Note 15)
Financial assets
at fair value through OCI (Note 16)
Financial assets
at fair value through profit or loss
(Note 17) Financial assets
held at amortised cost (Note 18)
Prepaid operating lease (Note 19)
Deferred income tax asset (Note 20(i))
Current assets
Inventories (Note 21)
Financial assets
at fair value through OCI (Note 16)
Financial assets
held at amortised cost (Note 18)
Cash and cash equivalents (Note 31)
Assets held for sale (Note 22)
Total assets
861 526 2 2 2 2 847
222 2 169
683
463 698 - - 378 534 417 115 447 776 580 646 171 550 8
8
8
337 758
122 989 16 137 810 390 749 864 1 699 380 1 544 1 700 924 10 038 682
INTEGRATED REPORT 2019
