
Page 196 - CJ 2019 INTEGRATED REPORT
P. 196
194
NOTES TO THE FINANCIAL
STATEMENTS 31 DECEMBER 2019 (CONTINUED)
2 FINANCIAL
RISK MANAGEMENT (CONTINUED)
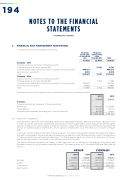
• Financial instruments by category (continued)
Company - 2019 Financial assets per statement of financial position:
Financial assets at fair value through OCI
Financial assets assets held at amortised cost-excluding non financial assets assets Cash and cash equivalents
Total 896 623 Company - 2018
Financial assets per statement of financial position:
Financial assets at fair value through OCI
Financial assets assets held at amortised cost-excluding non financial assets assets Cash and cash equivalents
Total 774 888
Financial liabilities for the Company are are all carried at amortised cost and are are as follows:
Company Financial liabilities per statement of financial position:
12 12 781 781 12 12 781 781 - 888
255 - 8 8 368 12 781 909 404
11 11 992 992 11 11 992 992 - 764 035 - 10 853 11 992 786 880
2018
Rs’000
Financial assets held at amortised cost Rs’000
Financial assets at fair value - 888
255 8 8 368 - 764 035 10 853 through OCI
Total Rs’000
Rs’000
Rs’000
Rs’000
2019 Rs’000
3 965 561
62 428
66 396
4
4
094 385
Borrowings 3 3 712 899 Lease liabilities 10 777 Trade and other payables (excluding non- financial liabilities) 74 684
3 3 798 360
(e) Capital risk management
The subsidiary’s objectives when managing capital capital are are to to to to safeguard the the Group’s ability to to to to continue as a a a a a a a a a a a a a a a a a a a a a going concern in in in in in in in in order order to to to to to to provide returns for for shareholders and and benefits for for other stakeholders and and to to to to to to maintain maintain an an an an optimal capital capital capital capital structure structure to to to to to to to reduce reduce the the the the the cost of of capital capital capital capital In order order to to to to to to to maintain maintain or or or or or or adjust adjust the the the the the capital capital capital capital structure structure the the the the the Group may adjust adjust the the the the the amount of of dividends paid to to to to to shareholders shareholders return capital capital capital to to to to to shareholders shareholders issue new shares or or or sell assets to to to to to reduce reduce debt The Group monitors capital capital on on on the the the basis of the the the gearing ratio ratio This ratio ratio is is is is calculated calculated as as as as net debt debt divided by total total capital capital Net debt debt is is is is calculated calculated as as as as as as as total total borrowings borrowings (including ‘current and and non-current borrowings’) as as as as as as as shown shown in in in in in in fin in fin the the the the statement statement of of financial financial position position less cash cash and and cash cash equivalents
The Group regards ‘equity’ as as as as as as as shown shown in in in in in fin in fin in the the statement statement of of financial financial position position as as as as being capital capital capital Total capital capital capital is calculated as as as as capital capital capital plus net debt The The Board of of of of Directors assesses the the the the impact of of of of each significant new investment investment on the the the the gearing gearing of of of of the the the the Group and and Company as as as part of of of of the the the the investment investment appraisal process The The gearing gearing ratios at at 31 December 2019 and and 2018
were as as as follows:
GROUP
2018
Rs’000
Net debt 4
4
4
4
470 486 Capital 1 1 1 1 1 373 441
COMPANY 2018
Rs’000
3 3 712 823
1 338 537 5
5
051 360
73 50%
2019 Rs’000
6 6 6 063 436
1 1 1 620 911
7 7 684
347
78 9%
2019 Rs’000
3 3 957 193
1 256 079
5
213 272
75 9%
Total capital Gearing ratio 5
843 927 76 50%
CURRIMJEE JEEWANJEE AND COMPANY LIMITED
