
Page 239 - CJ 2019 INTEGRATED REPORT
P. 239
237
NOTES TO THE FINANCIAL
STATEMENTS 31 DECEMBER 2019 (CONTINUED)
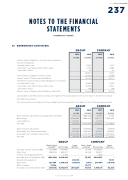
25 BORROWINGS (CONTINUED)
Finance lease lease obligations - minimum lease lease payments
Amounts falling due:
Not later than 1 year
Later than than 1 year
year
and not later than than 5 years Later than 5 years Future finance finance charges on finance finance leases
Present value of finance lease obligations The present value of finance lease obligations is as as follows:
Not later than 1 year
Later than than 1 year
year
and not later than than 5 years Later than 5 years INTEGRATED REPORT 2019 GROUP
2018
Rs’000
7
002 11 735 70 18
807
(2 063) 16 744
6
082 10 593 69 16 744
This section sets out an an an analysis of of of the the the net net debt debt and the the the movements in net net debt debt of of of each of of of the the the periods presented 2019 Rs’000
- - - - - - 2019 Rs’000
- - - COMPANY 2018
Rs’000
4 107 7
993 70 12 170
(1 393) 10 777
3 505 7
204 68 10 777
Present value of finance lease obligations (Note 30)
Lease liabilities are effectively secured as as as as the the the the rights to to the the the the leased assets revert to to the the the the lessor in the the the the event of default Net debt reconciliation
Net debt as at 01 01 January 2018
Cash flows
Foreign exchange adjustments
Net debt as at 31 December 2018
Recognition/acquisition - - - - Lease liabilties
- 1 1 1 174 918 (130 651)
- 1 044 267
Cash/ bank overdraft
31 700 40 556 - 72 256 - (1 371) 10 777
81 662
Borrowings
3 3 430 820 204 817 4 930 3 640 567 - 234 964 - 3 3 875 531
Lease liabilties
- 73 191 (10 763)
- 62 428
Cash flows
Other changes
Net debt as at 31 December 2019 1 280 422 - 6
6
360 850
(321 600) (288 342)
4 4 409 821 665 677 4 930 5 080 428
- - - - - - - 295 784 16 744
(297 414)
(609 942)
GROUP
COMPANY 2018
Rs’000
72 256 3 640 567 - 3 3 712 823
(10 853) 150 000
3 3 573 676 3 3 712 823
2019 Rs’000
(297 414)
6
6
360 850
1 044 267
7
7
7
107 703
(601 847)
1 450 000
6
259 550
7
7
7
107 703
2019 Rs’000
81 662
3 3 875 531
62 428
4 019 621
(8 368)
150 000
3 877 989
4 019 621
Cash and cash equivalents (including bank overdraft) Borrowings
Lease liabilities Net debt 2018
Rs’000
(609 942)
5 080 428
- 4 4 4 470 486
(749 864)
500 000
4 720 350 4 4 4 470 486
Cash and cash equivalents Gross debt with fixed interest rates Gross debt with variable interest rates Net debt (Cash)/ bank overdraft
GROUP
Borrowings
COMPANY 