
Page 7 - CJ 2019 INTEGRATED REPORT
P. 7
PERFORMANCE HIGHLIGHTS
The Group’s consolidated revenue improved by 3 1%
year-on-year to to reach Rs 5 billion with both the TMIT and Hospitality clusters contributing to to this growth The Group’s operating profit rose by over 12% compared to last year partly as as a a a a a a a a a a a result o of fair value gain on investment properties within the the the Hospitality cluster’s companies companies The other companies companies of the the the the Group except for for the the the the Hotel performed comparably well despite the the headwinds that we we had anticipated for for for some time CJ recorded a a a a a a a consolidated NPBT of of Rs 636 million
for the year under review marginally above that of of 2018
The Group’s finance cost cost in fin in in 2019 was negatively impacted by the the the borrowing costs at at at the the the level of of the the the Hotel in in in its first four months of of of operations In addition higher higher borrowings at at at the level of of Emtel to cater for higher higher investment in in in in in network capacity and redundancy in in in in in international connectivity have also added to this cost line The Group NPAT stood at Rs Rs 438 million
million
in in 2019 compared to to Rs Rs 420 million
million
in 2018
The Group’s Other comprehensive income was impacted by by a a a a a couple of of large figures mainly driven by by the the the performance of of the the Group’s quoted investments in in in in India and adjustments to changes in in in in in in retirement benefits measurements in in in in in in line with IAS 19
19
The fair value gain on on the investments attained Rs 202 million
for 2019 made up up of an an an increase in in in in share price coupled with a a a a a a a a a a a a a a favorable exchange difference On the the the other hand changes in in in actuarial assumptions including the the the the mortality experience have negatively impacted the the the liability for retirement benefits to the the tune of Rs 100 million
in 2019 The Group’s total comprehensive income ended the year 2019 at at Rs Rs 591 million
million
compared to to to Rs Rs 182 million
million
in in in 2018
with the amount attributable to to to owners reaching Rs Rs 337 million
million
in in in in 2019 compared to to a a a a a a loss of Rs Rs 106 million
million
in in 2018
The Group’s total assets increased by 29% in in in 2019 to to reach nearly Rs 13 billion This was achieved mainly as as as as a a a a a a a a a a a a a a a a result of of an an increase increase in in in in in in capex investments at the level of of of TMIT & Hospitality an an an an increase increase in in in in in in in fair value of of investments and and and investment investment properties and and and also changes in in in in in in in in in accounting standards pertaining to leases The increase in in in in in in in fin in in in capex investments has been partly financed by debt resulting in in in fin in in in in in a a a a a a a a slight drop in in in fin in in in in in our return on capital employed from 13 25%
fin in in in in in 2018
to 12 61%
fin in in in in in 2019 In 2019 a a a a a a number of of actions were initiated towards
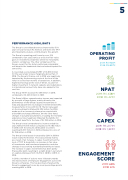
the the the improvement of of Employee Engagement across the the the Group’s Group’s companies This has positively impacted the the the Group’s Group’s engagement score by seven percentage points reaching 68% in in 2019 OPERATING PROFIT
2019: RS RS 924M 2018: RS RS 827M
NPAT 2019: RS RS 438M 2018: RS RS 421M
CAPEX
2019: RS RS 2 2 2 171M 2018: RS RS 1 1 1 1 1 1 341M
ENGAGEMENT SCORE 2019: 68% 2018: 61%
INTEGRATED REPORT 2019 5
