
Page 191 - CJ 2019 INTEGRATED REPORT
P. 191
189
2 (c)
NOTES TO THE FINANCIAL
STATEMENTS 31 DECEMBER 2019 (CONTINUED)
FINANCIAL
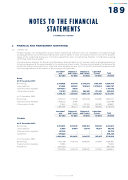
RISK MANAGEMENT (CONTINUED)
Liquidity risk Prudent liquidity risk management policies implies maintaining sufficient cash the the the availability of of funding through an an an an adequate amount of of of committed credit facilities and the the the the the ability ability to to close out market positions Due to to the the the the the dynamic nature of of the the the the underlying businesses the the the the finance department aims at at at maintaining flexibility in in fin in in in in in in in funding by keeping committed credit lines available The The tables below analyses the the the the the the Group’s and Company’s financial liabilities into relevant maturity maturity groupings based on on the the the the the the the the remaining period at at at at at at the the the the the the the the reporting date date to to the the the the the the the the contractual contractual maturity maturity date date The The amounts disclosed fin in in in in in in in the the the the the the the the table table are are the the the the the the the the contractual contractual undiscounted cash flows Trade and and other payables are are due within 12 months and and therefore approximate their carrying balances as as the the the impact of discounting is is is not significant Trade and other payables Life assurance funds
Company 1 309 522 111 842 3 661 506
Less than 1 year
Rs’000
Less than 1 year
Rs’000
Borrowings 2 2 787 826
Between 1 and 2 years
Rs’000
915 441 182 365 6 825 85 354 1 1 189
985
1 1 714 396 16 16 166 111 555 1 1 1 842 117
Between 1 and 2 years
Rs’000
609 536 10 869 - - 620 405
1 1 456 170 - - 1 1 456 170 Between 2 and 5 years
Rs’000
2 370 334 398 583 - 288 861 3 057 778
1 632 508 - 312 553 1 1 945 061
Between 2 and 5 years
Rs’000
1 1 388 182 19 949 - - 1 1 1 408 131
1 056 035 - - 1 056 035 Later than 5 years
Rs’000
1 733 338 1 073 854 - 511 465 3 3 318 657
305 991 - 463 901 769 892
Later than 5 years
Rs’000
109 656 14 207 - - 123 863
250 361 - - 250 361 Total Rs’000
7 806 939 1 866 787 1 1 1 471 152 999 863
12 144 741
5 893 037 1 325 688 999 851 8 8 218 576
Total Rs’000
4 4 418 013 56 055 66 396 576
225 5 116 689
4 4 186 947 74 684 604 240 4 865 871
Group At 31 December 2019 Lease liabilities Trade and other payables Life assurance funds
211 985
1 464 327 114 183 4 578 321
At 31 December 2018
Borrowings 2 2 2 240 142
INTEGRATED REPORT 2019 At 31 December 2019 Borrowings 2 310 639 Lease liabilities 11 030 Trade and other payables 66 396 Guarantees 576
225 2 2 964 290
At 31 December 2018
Borrowings 1 1 424 381 Trade and other payables 74 684 Guarantees 604 240 2 103 305
