
Page 193 - CJ 2019 INTEGRATED REPORT
P. 193
191
2
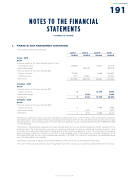
FINANCIAL RISK MANAGEMENT (CONTINUED)
• Fair values hierarchy (Continued)
Group - 2018
Assets
Financial assets at fair value through profit or loss
- Trading securities
Land and and buildings
Financial assets at fair value through OCI
- Equity securities
- Debt securities
Total assets Company – 2019
Assets
Financial assets at fair value through OCI
- Equity securities
Land and and buildings
Total assets Company – 2018
Assets
Financial assets at fair value through OCI
- Equity securities
Land and and buildings
Total assets NOTES TO THE FINANCIAL The Group Group is is exposed to to equity securities
securities
and and debt securities
securities
price risks If the the the the the fair fair value value of o the the the the the investments increases/ decreases by by 5% other factors remaining unchanged the the the the the Group’s profit profit for the the the the the year and and and financial financial assets assets (at fair fair fair value value value through through profit profit or or or loss
and and financial financial assets assets at at fair fair value value through through OCI) would increase/decrease by by Rs Rs 55 996 500 (2018 – Rs 44 051 400) The The Group’s financial assets assets valued at at at at fair fair value value value through profit or loss
are directly related to to the the fair fair valuation valuation o of the the investee investee entity entity The The The investee investee entity entity uses various valuations methods to to value value value value its underlying investment investment investment assets assets assets Level 3 3 includes all investments investments classified as as as as as financial assets assets at at fair value value value value through profit or loss
The The investments investments have been valued using the the the share o of of net asset asset value value value value (“NAV”) and dividend yield o of of the the the respective investee companies At 31 December 2019
had the the the fair value value value increased/decreased increased/decreased by by 1% 1% (2018- 1%) valuation would have increased/decreased increased/decreased by Rs Rs 1 1 1 1 1 1 1 1 1 114 010 (2018 – Rs Rs 1 1 1 1 1 1 1 1 1 449 110) The Group is is exposed to equity securities
securities
and debt securities
securities
price risks as described in Note 2(a) The Level 3 financial assets at at at fair fair value value value through OCI
have been valued at at at cost and they approximate their fair fair values INTEGRATED REPORT 2019
STATEMENTS 31 DECEMBER 2019
(CONTINUED)
Level Level 1 Level Level 2
Rs’000
Rs’000
Rs’000
Rs’000
297 865 - - 861 526
337 618 - 1 1 604 82 041 637 087 943 567
3 - - 8
144 3 8
144 3 - - 8
122 3 8
122 Level 3 Rs’000
149 911 - 11 989 - 161 900
12 778
- 12 778
11 989 - 11 989 Total Rs’000
447 776 861 526
349 607 83 645 1 742 554
12 781 8
144 20 925
11 992 8
122 20 114
